(TI = 50 ms)
INCORRECT ANSWER
You selected a very short TI of 50 ms. Here is what an inversion recovery image with this TI would look like:
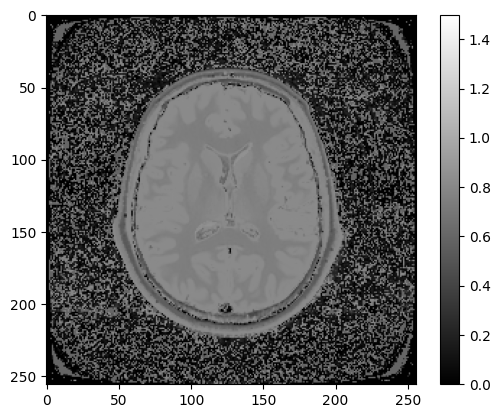
Figure 7.3:Inversion recovery image with TI = 50 ms, TR = 5 s, TE = 15 ms, FA = 90 degrees
As you can see, there is little contrast at all accross tissues for a very short TI, as can be deduced via Figure 2.3. No tissue signal is nulled. Here are the simulated images for the three other answers: Figure 7.4, Figure 7.5, and Figure 7.6.
The correct answer was D (TI = 3s). Here’s what that looks like,
As you can see, ventricles are quite dark, meaning this TI nulls the ventricular signal. This is clearly deduced from Figure 2.3 by hovering the cursor over the white matter signal where it crosses 0.
Now, despite knowing the correct inversion time, we still can’t see the lesions from Figure 7.6. We need to add T2 weighting to this inversion recovery image. What protocol should we use?
A - (TI = 3 s, TR = 10 s, TE = 150 ms, FA = 90 deg)
B - (TI = 3 s, TR = 5 s, TE = 15 ms, FA = 20 deg)