Fictitious Case Study: Patient with Neurological Symptoms Consistent with MS
Patient Presentation
A 32-year-old female presents to the neurology clinic with a 3-month history of intermittent numbness and weakness in her left leg, accompanied by episodes of blurred vision in her right eye. She reports that these symptoms last for several days and then partially resolve. She has no significant past medical history but mentions a family history of autoimmune diseases.
Clinical Suspicion
The patient’s symptoms are consistent with a demyelinating disorder, such as multiple sclerosis (MS). To confirm the diagnosis, the neurologist orders an MRI of the brain and spinal cord.
McDonald Criteria (2017) for MS Diagnosis
Clinical Attacks: At least two clinical attacks with evidence of two or more lesions OR two clinical attacks with evidence of one lesion (dissemination in space, DIS) and historical evidence of a prior attack.
MRI Evidence:
Dissemination in space (DIS): ≥1 T2 lesion in at least 2 of 4 MS-typical regions (periventricular, cortical/juxtacortical, infratentorial, or spinal cord).
Dissemination in time (DIT): Simultaneous presence of gadolinium-enhancing and non-enhancing lesions OR new T2 or gadolinium-enhancing lesions on follow-up MRI.
CSF Analysis: Oligoclonal bands in cerebrospinal fluid (CSF) can support the diagnosis if MRI criteria are not fully met.
Exclusion of Other Diagnoses: Symptoms must not be better explained by another condition.
The practicing radiologist provides you with two images and their acquisition protocols. Based on the parameters, you need to determine what types of images these are. Here are the protocols again for reference:
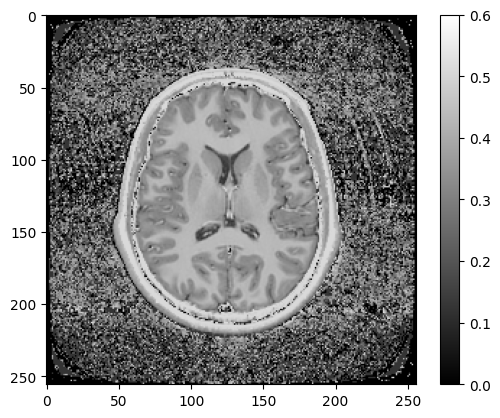
Figure 7.1:Spoiled gradient echo, 2 mm^2 in-plane resolution, 5 mm slice, TR = 1 s, TE = 15 ms, FA = 70 degrees
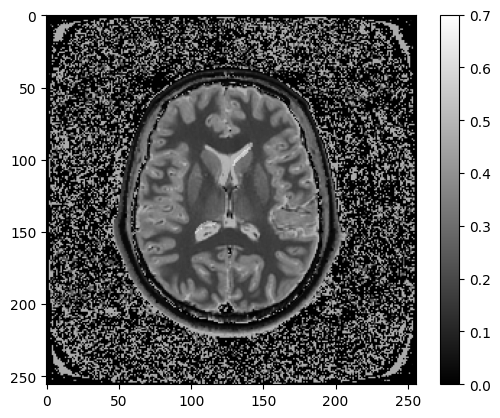
Figure 7.2:Spoiled gradient echo, 2 mm^2 in-plane resolution, 5 mm slice, TR = 5 s, TE = 150 ms, FA = 90 degrees
What types of MRI images are (Figure 7.1, Figure 7.2)?
A - (PD-weighted, T1-weighted)
B - (PD-weighted, T2-weighted)