| Proton density weighted | T1 weighted | T2 weighted | |
|---|---|---|---|
| Echo Time (TE) | Medium | Short | Long |
| Repetition time (TR) | Medium | Short | Long |
T1-weighted images are optimized for greater T1 contrast between tissues-of-interest, while T2-weighted images are optimized for greater T2 contrast between tissues-of-interest.
Revisiting Figure 2.8 and Figure 3.3, can you explain out why the T1w parameters were chosen to be [TR = 1 s, TE = 15 ms] and not [TR = 5s, TE = 150 ms]? Why was T2w protocol parameters [TR = 5s, TE = 150 ms] instead of [TR = 1 s, TE = 15 ms]?
Figure 2.2:Inversion recovery curves (Eq. 2.2) for three different T1 values, approximating the main types of tissue in the brain.
Figure 3.3:Transverse relaxation decay curves for T2 and T2* values in white matter and gray matter. The T2 and T2* constants were taken from Siemonsen et al., 2008.
A common trick is to remember that white-matter is white in T1-weighted images, and water is bright in T2-weighted images. Here are those images again:
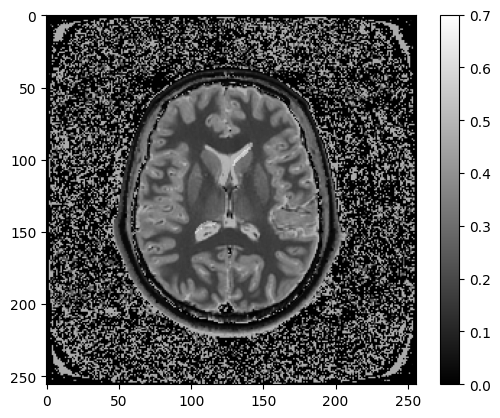
Figure 7.2:Spoiled gradient echo, 2 mm^2 in-plane resolution, 5 mm slice, TR = 5 s, TE = 150 ms, FA = 90 degrees
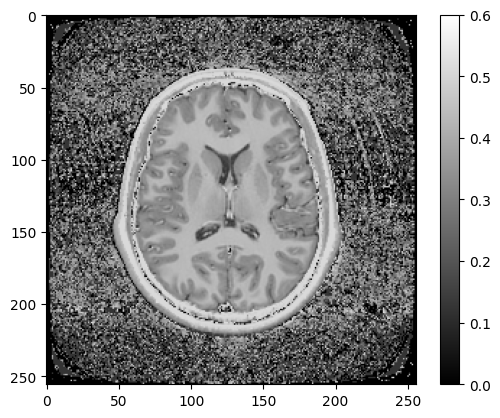
Figure 7.1:Spoiled gradient echo, 2 mm^2 in-plane resolution, 5 mm slice, TR = 1 s, TE = 15 ms, FA = 70 degrees