
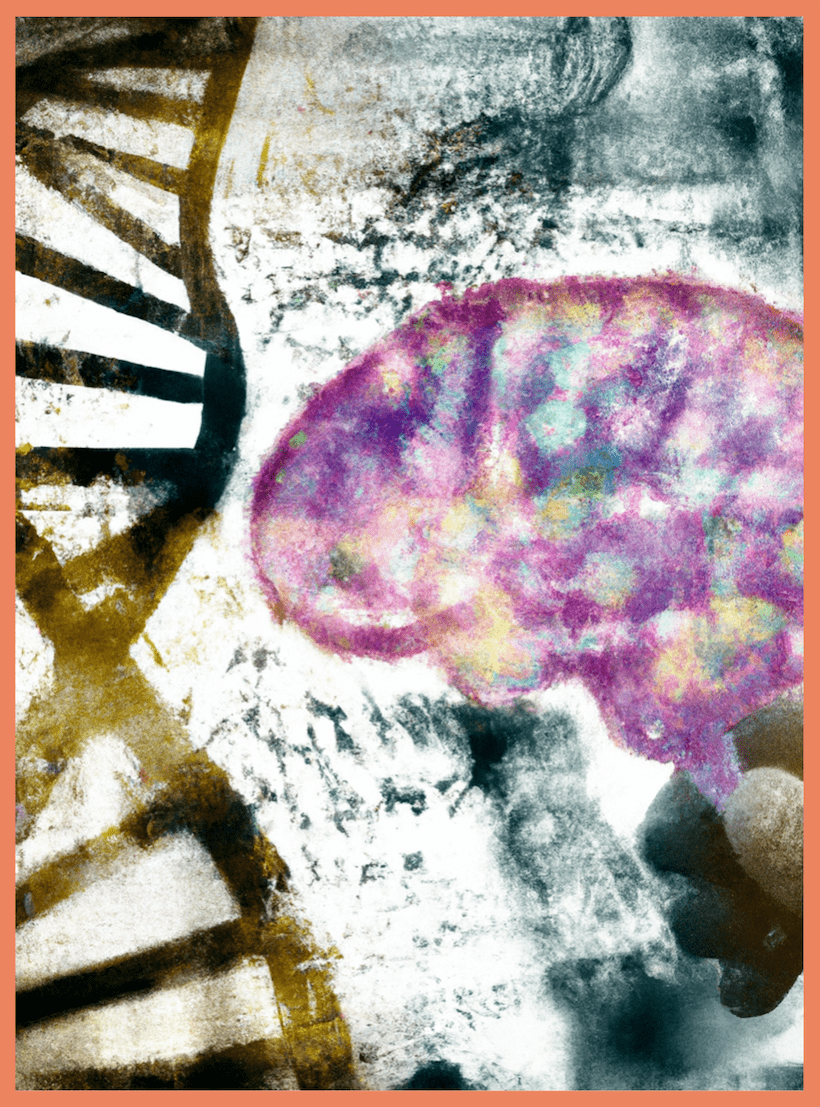
The Double Helix and MRI Part 1: DNA is Quantitative, MRI Is Not.
Quantitative magnetic resonance imaging (qMRI) is a medical imaging technique that lends itself very well to metaphors: it has previously been compared to a wide range of ideas and objects, from jelly beans and symphonic orchestras, to alphabet soups and Bento boxes. Continuing on with this tradition, we will now compare qMRI to something less unconventional in a science context: deoxyribonucleic acid (DNA) sequencing.
A conventional analogy to genetics.
There are many parallels to be made between neuroimaging and its sister field of genetics. Most neuroimagers are quite familiar with genetics as their training has exposed them, at the very minimum, to an overview of how to go from DNA to protein. And those with a heavy neuroscience background have likely had the misfortune to memorize a ghastly amount of transcription factors, DNA polymerases and ribosomal subunits to meet some course requirements. Whether overtly or not, most biological sciences are entrenched in genetic ideas and, elaborating on this further, we would like to make a point about how neuroimaging data science has drawn inspiration from the Human Genome Project (HGP) (Watson & Jordan, 1989).
Spanning from 1990 to 2003, this global initiative was largely driven by a post-Cold War fear of nuclear fallout and the resulting incentive to understand what radiation can do to our genome (L. Hood & Rowen, 2013). Importantly, the HGP pioneered the development of DNA sequencing technology. The late 1980s saw a significant milestone in the field of genetics, as scientists were able to direct the outputs of their DNA sequencing applications directly to a computer (L. E. Hood et al., 1987). In 2003, the completion of the HGP was announced (Collins et al., 2003), followed by the publication of the first euchromatic human genome in 2004 (International Human Genome Sequencing Consortium, 2004). It thus took almost 15 years and $3 billion to complete this first euchromatic reference genome (L. Hood & Rowen, 2013). Today, it is possible for anyone to obtain a whole-genome sequence of the same fidelity for less than $200 and with a wait time of 6 weeks (ps: Razib Khan has some valuable insights into why you may want to do this).
The incredible advances made in the field of genetics have naturally led to a need for scientists to learn how to manage large, multidimensional datasets and use advanced statistical tools. For example, between 2005 and 2020, over 4,300 genome-wide association studies (GWAS) have been published, linking over 55,000 different loci to nearly 5,000 diseases and traits (Loos, 2020). It is thus unsurprising that this era of rapid advancement has also brought with it a need for geneticists to develop new skills in data management and analysis.
 Fig. 1 – Major Human Genome Project publications (Source: HGP Overview Slides).
And here comes quantitative MRI.
Needless to say, the tremendous breakthroughs in genetics have captured the imagination of scientists in all fields, which may explain how we have arrived at using big data approaches in neuroimaging: magnetic resonance imaging (MRI) allows us to curate large-scale, high-resolution in vivo datasets that are ripe for computational analyses!
Just as the Human Genome Project (HGP) is a landmark in the field of genetics, the more recent Human Connectome Project (HCP) (Van Essen et al., 2013) is well-known in neuroscience. In fact, the similarity in their names is unlikely to be coincidental and suggests that the two projects aim to produce the same output for two different biological systems. However, despite their shared nomenclature, these two initiatives are pursuing distinct objectives. Whilst the goal of the HGP was to sequence the entire genome (≈3 billion base pairs) for one reference human, the goal of the HCP is to advance our understanding of brain connectivity through the collection and release of genetic, behavioral and high-resolution MRI data in as many human subjects as possible. In fact, a more accurate comparison to the HGP could be the recent mapping of the entire C. elegans worm connectome (Cook et al., 2019) of fewer than 400 neurons – which is significantly less than the 86 billion neurons of the human brain (Herculano-Houzel, 2012).
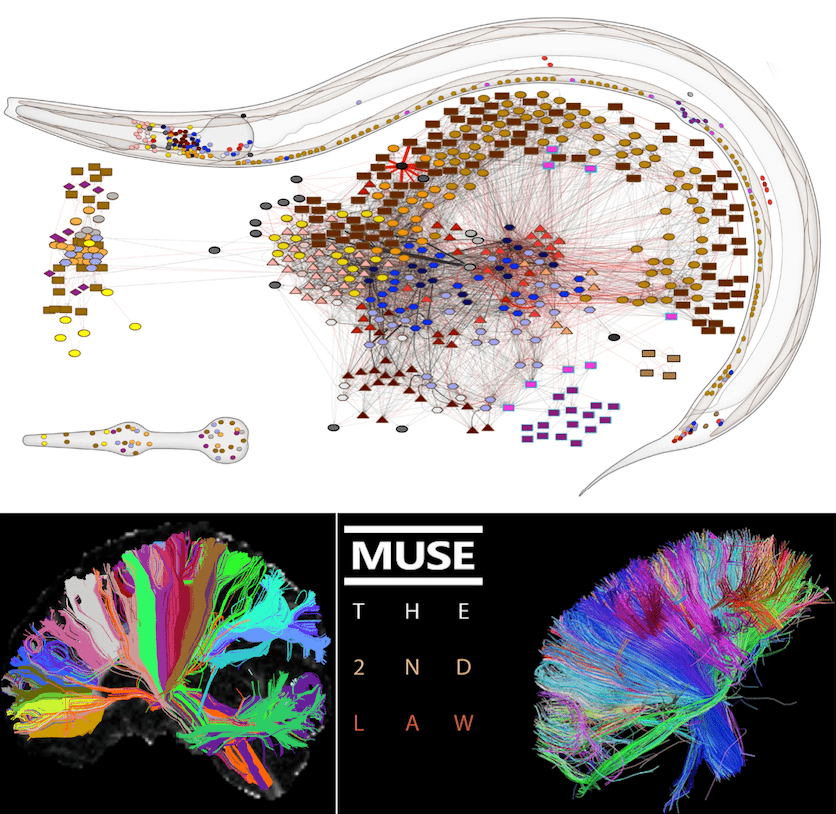 Fig. 2 – Top: adult hermaphrodite C. elegans nervous system from Fig. 1 b) of (Cook et al., 2019). Bottom left: from the Human Connectome Project. Bottom right: album cover of absolute legends.
Thus, for neuroimaging data scientists, the high-quality human MRI data of the HCP is of greater interest than electron micrographs of worms. The HCP is a massive undertaking, and the healthy young adult dataset alone includes data from 1,200 subjects, most of whom were scanned at 3T to produce anatomical images of human brains with an isotropic resolution of 0.7 mm. This means that each subject has over 60 million ((260 mm / 0.7 mm) x (311 mm / 0.7 mm) x (311 mm / 0.7 mm)) features, or voxels. To handle ≈ 1,200 observations (n) of ≈ 60 million features (p), we often borrow statistical tools from geneticists, who have experience working with large whole-genome sequence datasets and handling the pernicious p » n problem. However, it is important to remember that the conventional MRI data we work with is qualitative, as the voxels we use only encode unitless intensity values in an arbitrary grayscale range. This makes it challenging to identify biological variability in the data and distinguish it from noise (Novikov et al., 2018; Weinberger & Radulescu, 2016).
Geneticists are fortunate to work with truly quantitative information, as DNA can be reduced to sequences of base pairs: adenine (A), thymine (T), guanine (G), and cytosine (C). Not only do geneticists have the advantage of working with the “building blocks” (or “bits”) of biology, but these building blocks are so well-organized that they are the same across all 30 trillion cells in the human body (Sender et al., 2016). Furthermore, only about 0.1% of the 3 billion base pairs in the human genome vary among individuals (Van Essen et al., 2013), which provides a high level of consistency in genetic data. This point is even raised in the original HCP release paper itself (Van Essen et al., 2013): “Hence, high sensitivity to sequence variants is critical for being able to characterize individual genomic differences and to relate these differences to phenotypes of interest. In contrast, the accuracy with which human brain connectivity can be quantitatively assessed is much lower than for genome sequencing, but the degree of individual variability is far greater.”
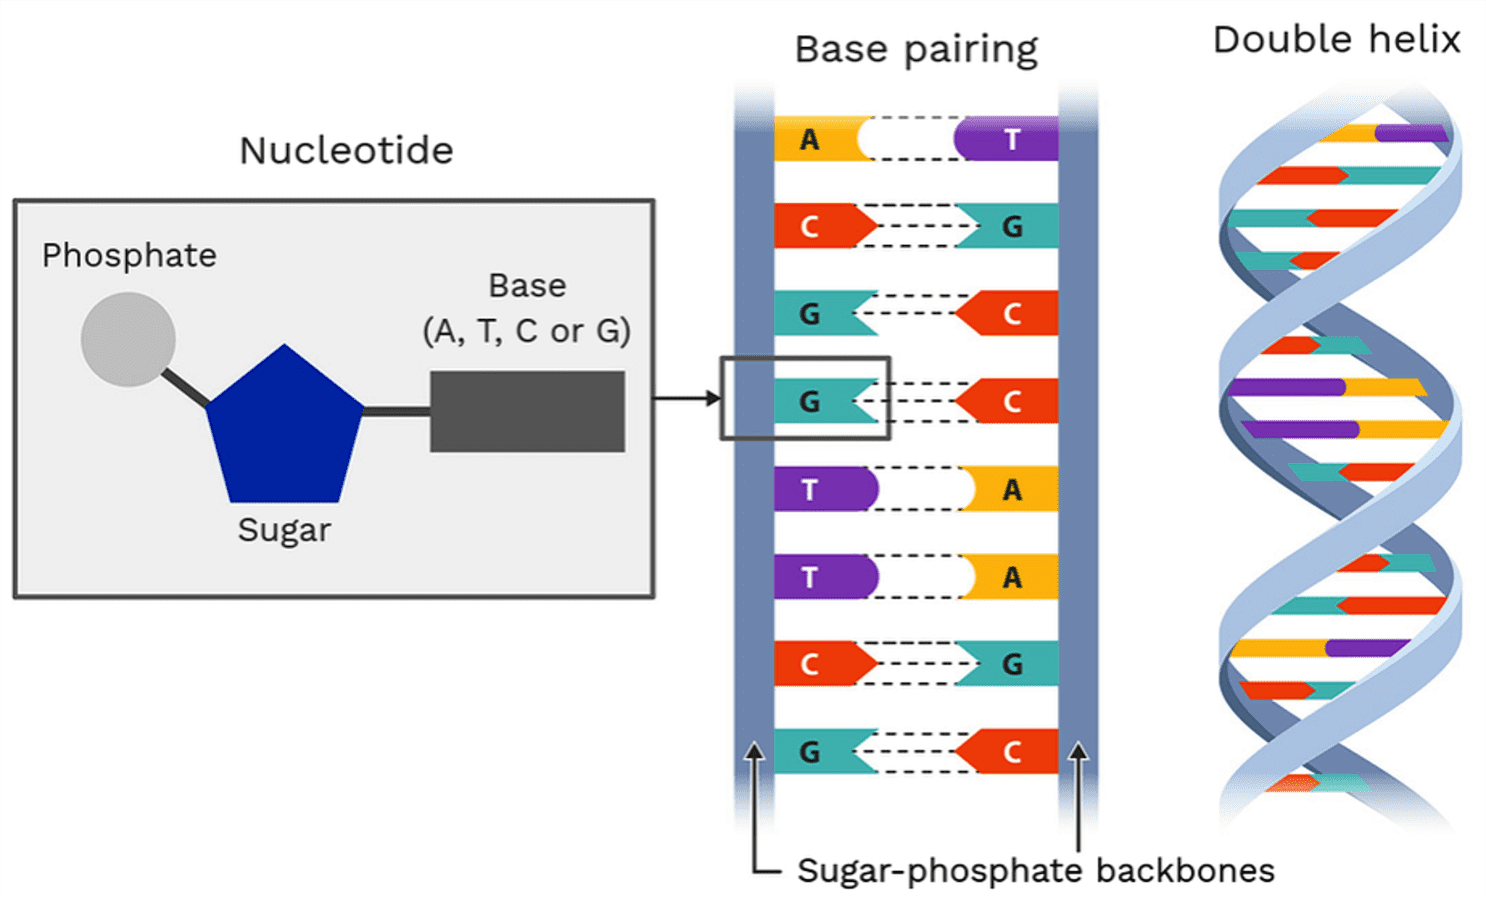 Fig. 3 – Structure of DNA.
Consequently, neuroimaging data scientists often apply tools developed for consistent and quantitative genetic data to data that is not only qualitative, but also highly variable across individuals. This can be a difficult task, but significant efforts are being made to address the lack of quantitative and ground truth information in neuroimaging. Some researchers believe that with sufficiently large sample sizes, reproducible workflows, and advanced data engineering and analysis tools (Glatard et al., 2015; Kiar et al., 2020; Lindquist, 2020), it will be possible to differentiate biological variability from noise. Others are working on mapping histological data (often regarded as the ground truth information that conventional MRI is lacking) to neuroimaging data (Amunts et al., 2013).
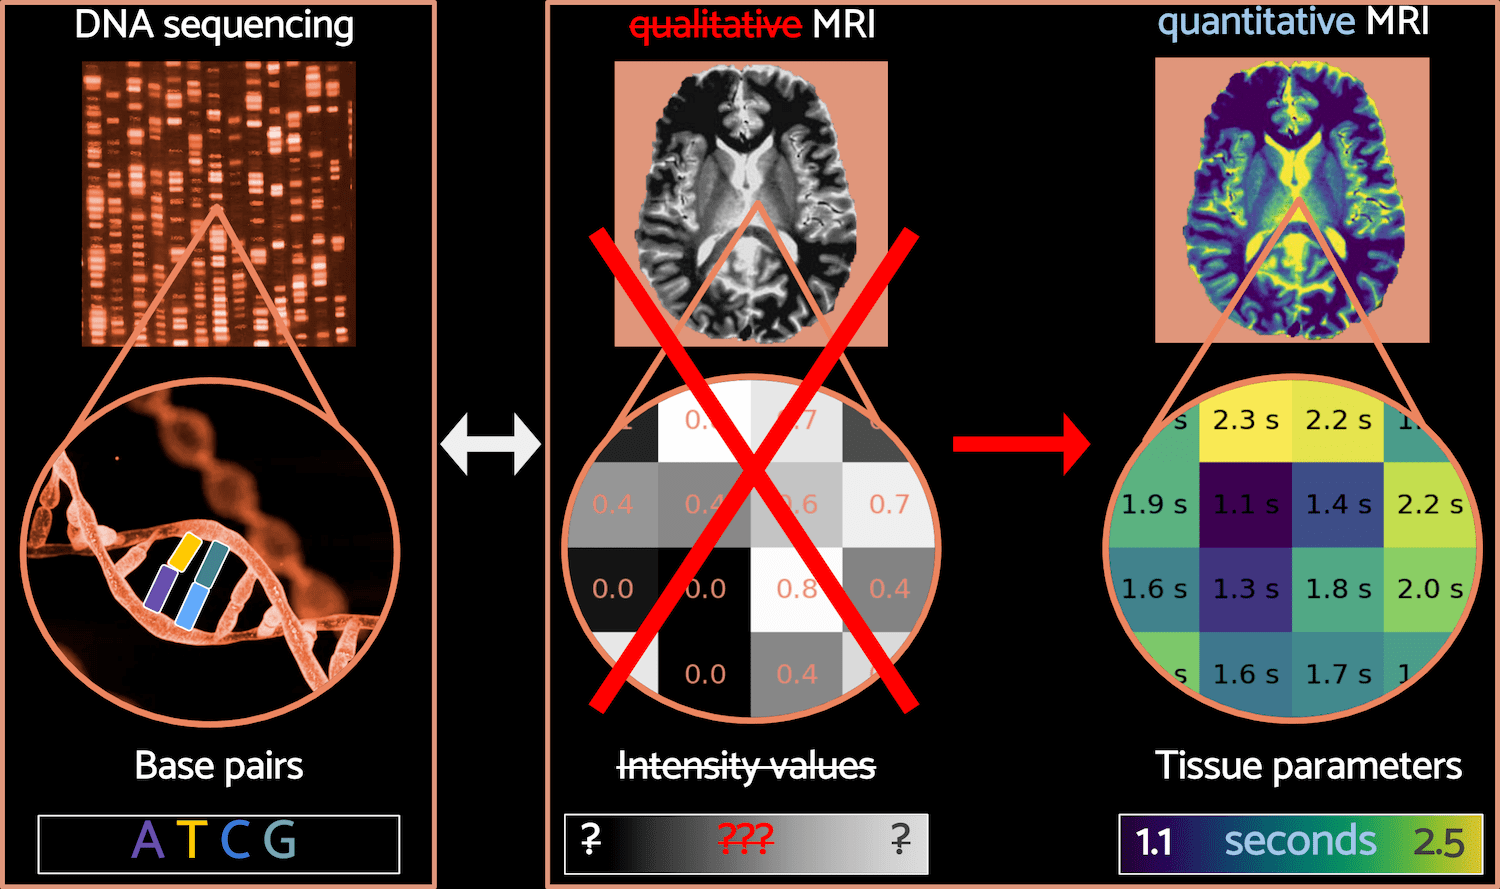 Fig. 4 – The parallel between DNA sequencing and qMRI. Image sources: image from the National Human Genome Research Institute (top left),chromosomal DNA (bottom left), brain images from Karakuzu et al. 2022 (top center and top right).
But what about making MRI quantitative? MRI is a versatile medical imaging technique that relies on the manipulation of atomic tissue properties to produce an image. By acquiring a set of MR images whilst systematically varying a predetermined set of parameters, scientists can estimate real-world tissue properties, such as T1 and T2 relaxation times or proton density (Bottomley et al., 1984; Damadian, 1971). This is the essence of quantitative MRI (qMRI) and it is currently the closest technique we have to actually turning MRI scanners into measurement devices.
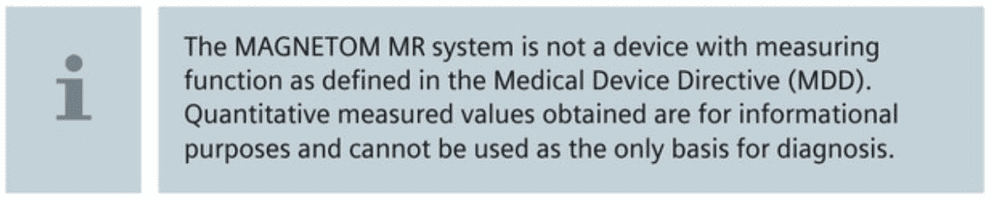 Fig. 5 – Excerpt from the Siemens MAGNETOM Skyra fit Operator’s Manual; referenced in a talk by Dr. Nikola Stikov.
DNA and qMRI: concluding remarks.
On Razib Khan’s Unsupervised Learning podcast, Erik Hoel pointed out that while our understanding of genetics is largely due to our ability to manipulate it, our understanding of the brain has been held back by our inability to manipulate it in a controlled way. However, with the help of medical imaging techniques that can accurately quantify real-world tissue characteristics, we may be able to probe the brain in a more systematic and theory-driven manner. After all, understanding what we are measuring is key to developing analytical models that correctly take into account the complex physical properties of biological systems (Novikov et al. 2018).
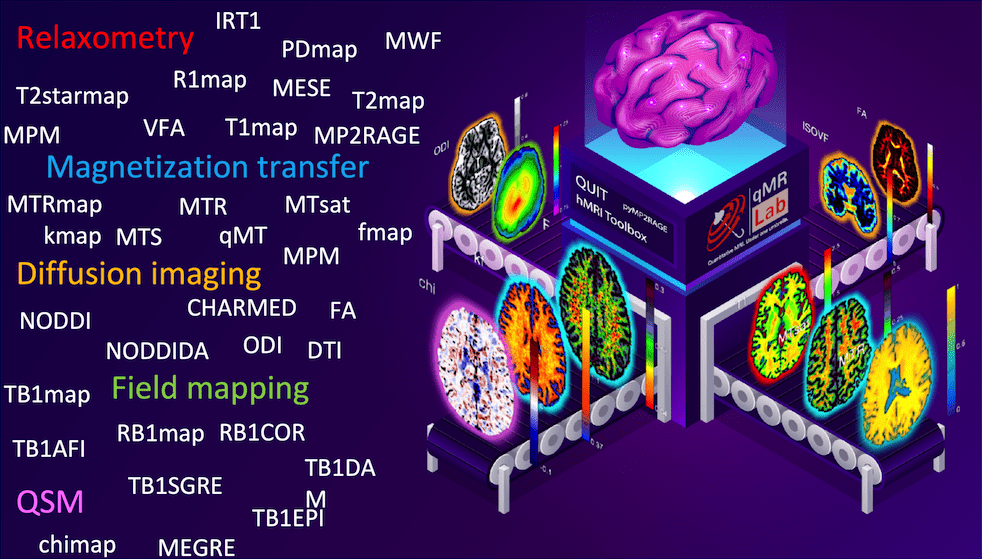 Fig. 6 – qMRI methods (left) and diagram (right) by Dr. Agâh Karakuzu.
Acknowledgements.
Essay edited by Dr. Nikola Stikov. A special thank you to Dr. Mathieu Boudreau and Dr. Agâh Karakuzu for reading drafts of this essay. And a slightly suspicious thank you to OpenAI’s infant digital monsters for their chilling artistic and stylistic contributions.
Up next.
In The Double Helix and MRI Part 2: qMRI-BIDS, the analogy between genetics and MRI will continue on a metaphorical level as we dive into cellular machinery and the qMRI-BIDS data standard, the development of which was led by Dr. Agâh Karakuzu.
References
- Amunts, K., Lepage, C., Borgeat, L., Mohlberg, H., Dickscheid, T., Rousseau, M.-É., Bludau, S., Bazin, P.-L., Lewis, L. B., Oros-Peusquens, A.-M., Shah, N. J., Lippert, T., Zilles, K., & Evans, A. C. (2013). BigBrain: an ultrahigh-resolution 3D human brain model. Science, 340(6139), 1472–1475.
- Bottomley, P. A., Foster, T. H., Argersinger, R. E., & Pfeifer, L. M. (1984). A review of normal tissue hydrogen NMR relaxation times and relaxation mechanisms from 1-100 MHz: Dependence on tissue type, NMR frequency, temperature, species, excision, and age. In Medical Physics (Vol. 11, Issue 4, pp. 425–448). https://doi.org/10.1118/1.595535
- Collins, F. S., Green, E. D., Guttmacher, A. E., Guyer, M. S., & US National Human Genome Research Institute. (2003). A vision for the future of genomics research. Nature, 422(6934), 835–847. Cook, S. J., Jarrell, T. A., Brittin, C. A., Wang, Y., Bloniarz, A. E., Yakovlev, M. A., Nguyen, K. C. Q., Tang, L. T.-H., Bayer, E. A., Duerr, J. S., Bülow, H. E., Hobert, O., Hall, D. H., & Emmons, S. W. (2019). Whole-animal connectomes of both Caenorhabditis elegans sexes. Nature, 571(7763), 63–71.
- Damadian, R. (1971). Tumor Detection by Nuclear Magnetic Resonance. In Science (Vol. 171, Issue 3976, pp. 1151–1153). https://doi.org/10.1126/science.171.3976.1151
- Glatard, T., Lewis, L. B., Ferreira da Silva, R., Adalat, R., Beck, N., Lepage, C., Rioux, P., Rousseau, M.-E., Sherif, T., Deelman, E., Khalili-Mahani, N., & Evans, A. C. (2015). Reproducibility of neuroimaging analyses across operating systems. Frontiers in Neuroinformatics, 9, 12.
- Hood, L. E., Hunkapiller, M. W., & Smith, L. M. (1987). Automated DNA sequencing and analysis of the human genome. Genomics, 1(3), 201–212.
- Hood, L., & Rowen, L. (2013). The Human Genome Project: big science transforms biology and medicine. Genome Medicine, 5(9), 79.
- International Human Genome Sequencing Consortium. (2004). Finishing the euchromatic sequence of the human genome. Nature, 431(7011), 931–945.
- Kiar, G., de Oliveira Castro, P., Rioux, P., Petit, E., Brown, S. T., Evans, A. C., & Glatard, T. (2020). Comparing perturbation models for evaluating stability of neuroimaging pipelines. The International Journal of High Performance Computing Applications, 34(5), 491–501.
- Lindquist, M. (2020). Neuroimaging results altered by varying analysis pipelines [Review of Neuroimaging results altered by varying analysis pipelines]. Nature, 582(7810), 36–37.
- Loos, R. J. F. (2020). 15 years of genome-wide association studies and no signs of slowing down. Nature Communications, 11(1), 5900.
- Novikov, D. S., Kiselev, V. G., & Jespersen, S. N. (2018). On modeling. Magnetic Resonance in Medicine: Official Journal of the Society of Magnetic Resonance in Medicine / Society of Magnetic Resonance in Medicine, 79(6), 3172–3193.
- Sender, R., Fuchs, S., & Milo, R. (2016). Revised Estimates for the Number of Human and Bacteria Cells in the Body. PLoS Biology, 14(8), e1002533.
- Van Essen, D. C., Smith, S. M., Barch, D. M., Behrens, T. E. J., Yacoub, E., Ugurbil, K., & WU-Minn HCP Consortium. (2013). The WU-Minn Human Connectome Project: an overview. NeuroImage, 80, 62–79.
- Watson, J. D., & Jordan, E. (1989). The Human Genome Program at the National Institutes of Health. Genomics, 5(3), 654–656.
- Weinberger, D. R., & Radulescu, E. (2016). Finding the Elusive Psychiatric “Lesion” With 21st-Century Neuroanatomy: A Note of Caution. American Journal of Psychiatry, 173(1), 27–33.

|
Except where otherwise noted, the content on this blog is licensed under a Creative Commons Attribution 4.0 International license.
|