Why MRI Isn't Quantitative (Yet)
Pixels have values, then why is MRI not quantitative?
1Pixels have values, then why is MRI not quantitative?
1.1A sweet jellybean analogy
In the clinics, MRI stands out as one of the most preferred imaging methods, because it can generate detailed images with superb soft tissue contrast, without using ionizing radiation or cutting open the human body. Surprisingly, MRI scanners have also been extensively used in food science to study soft tissue. For example, several studies used MRI to observe how moisture migrates towards the center of jellybeans over time Troutman et al., 2001Ziegler et al., 2003
Be it in diagnostic radiology, or in food science, it is the superior soft tissue contrast that makes MRI appealing. In routine diagnostic readings, the radiologists browse through MR images to capture abnormalities that may be resolved by conventional MRI contrasts, i.e. T1- or T2-weighted images. As a result, the detection of pathological patterns depends on a radiologists’ visual assessment, which is then transferred to a written report – a narration of observations – such as:
T2 hyperintense appearance in the left parieto-occipital lobe suggests hemorrhagic infarction Fig. 1f.
Here, the word hyperintense implies a relative comparison. Fig. 1e illustrates that cropping the tumorous region away from the image removes the basis of comparison and makes the hyperintense appearance irrelevant. This is because the pixel brightness of conventional MR images is assigned using an arbitrary scale consisting of shades of gray. Due to the lack of a calibrated measurement scale, conventional MRI is considered to be qualitative.
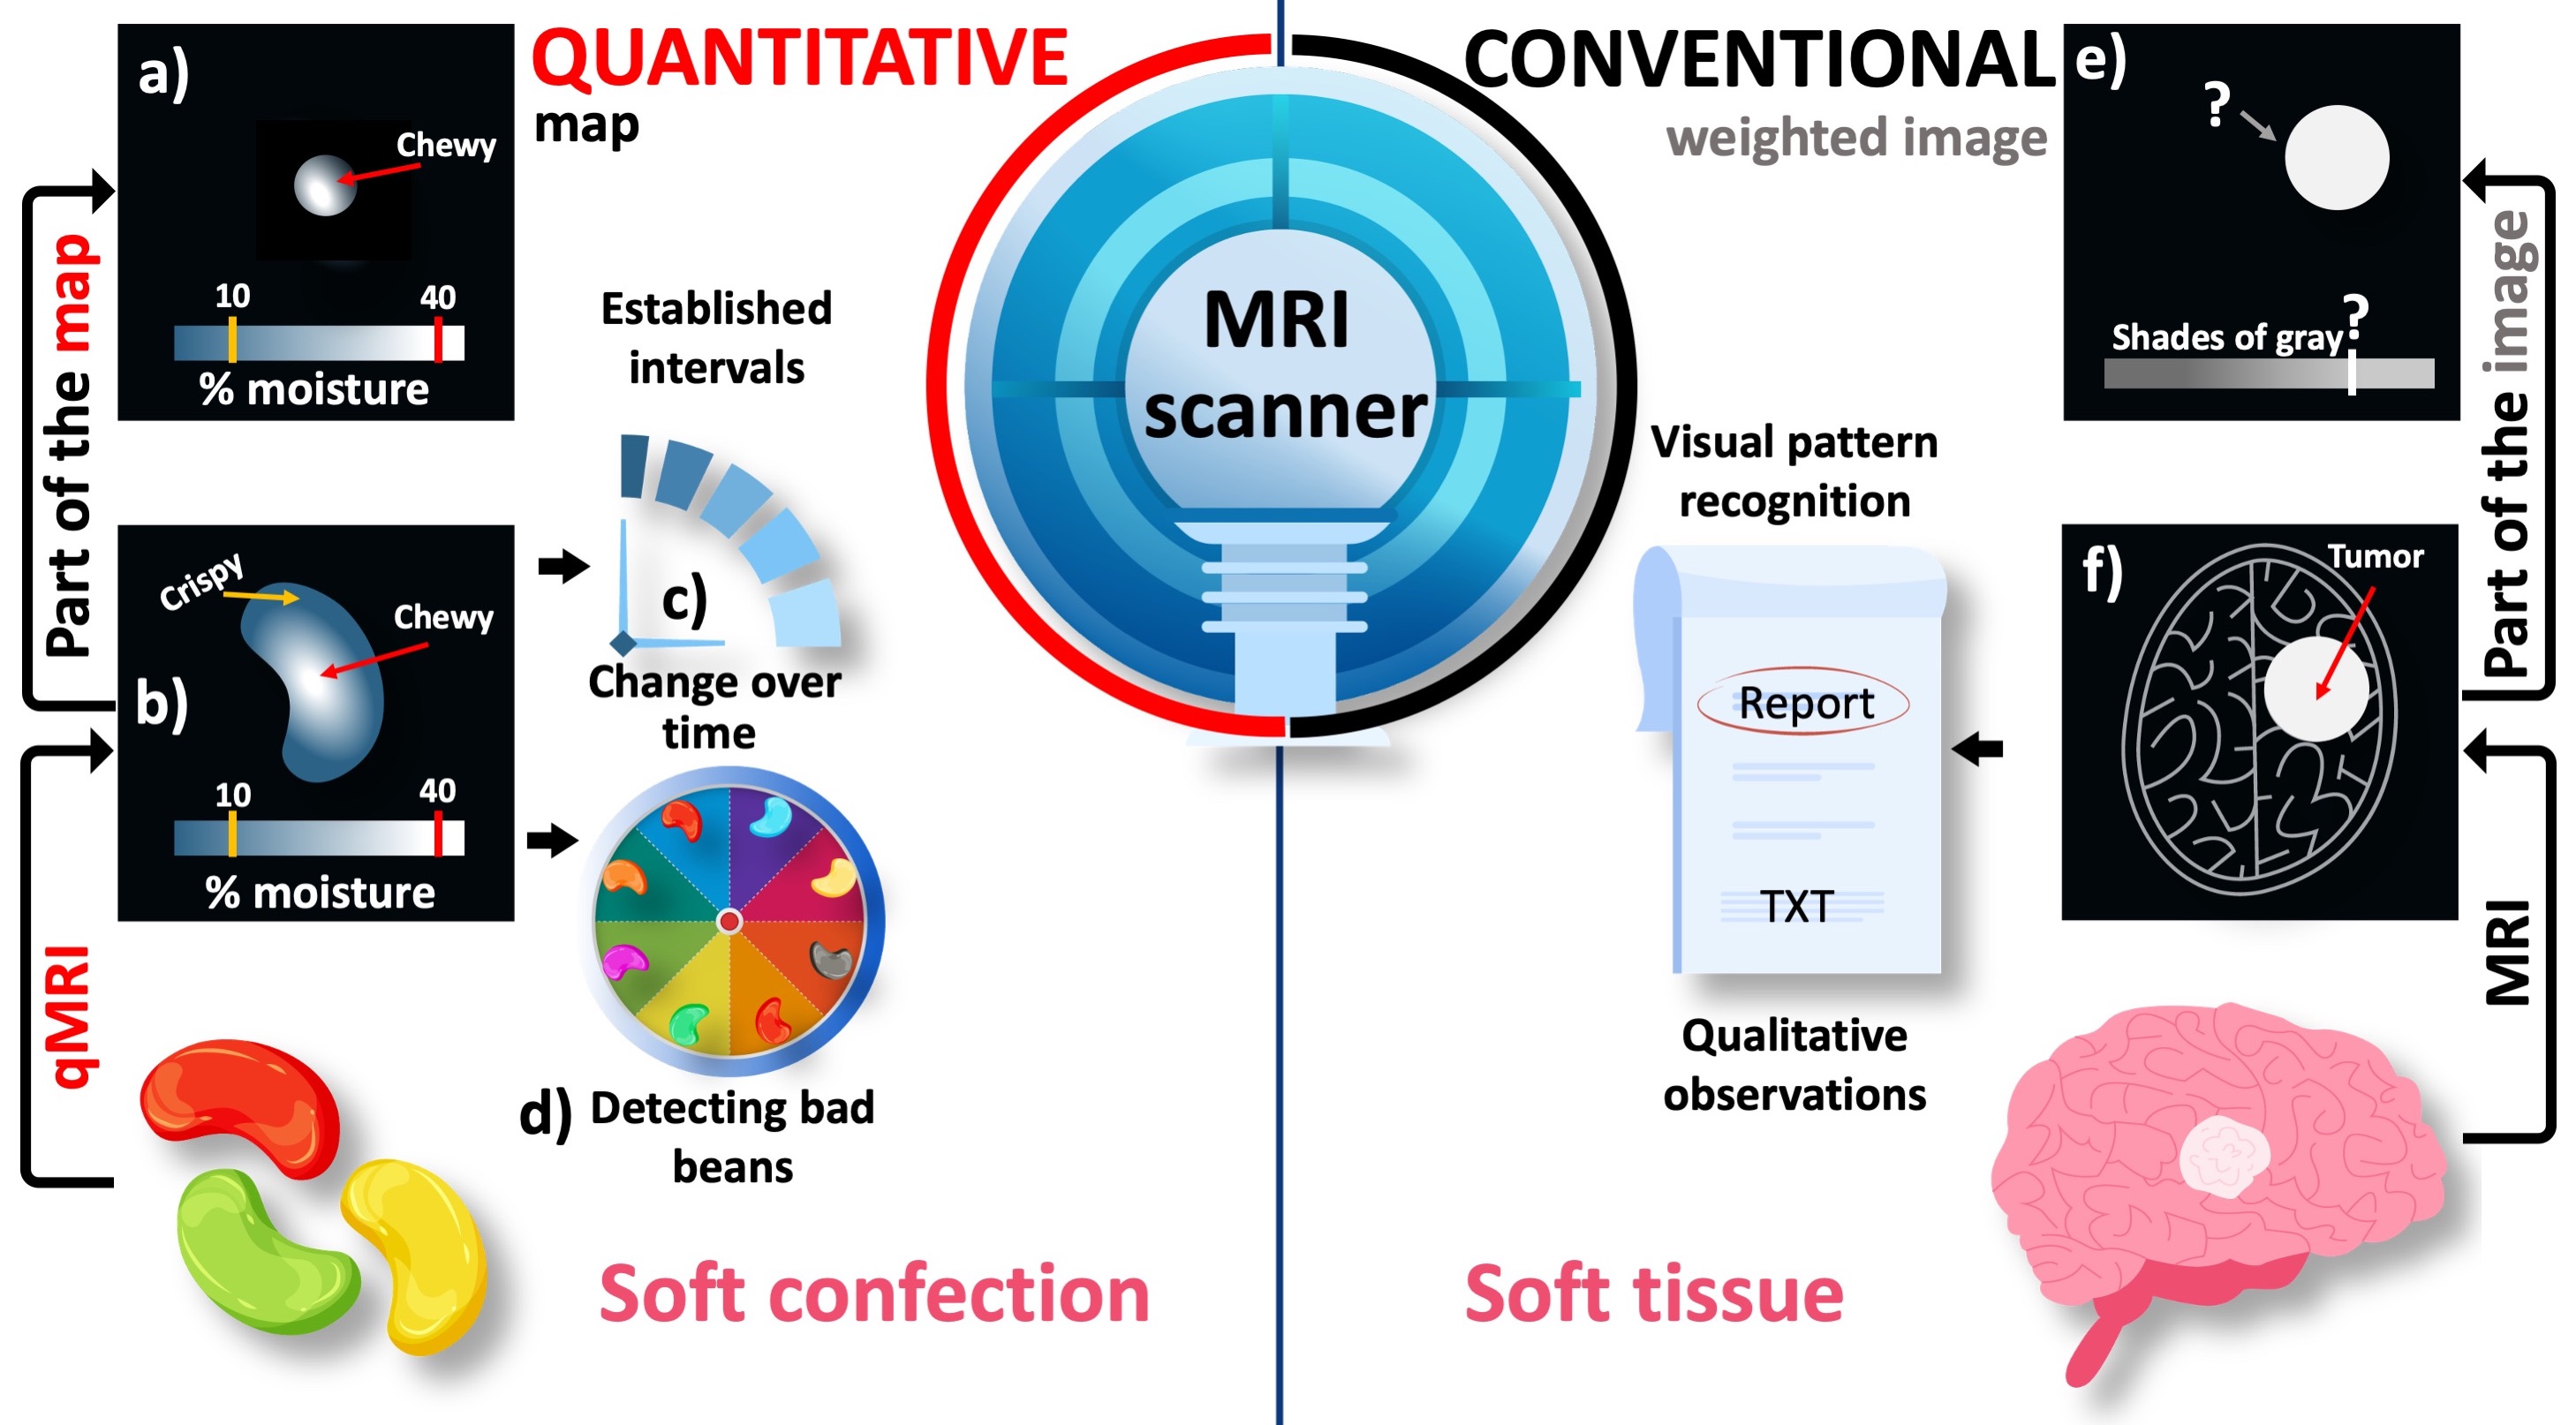
Figure 1:An illustrative comparison between the conventional and quantitative MRI (qMRI). The pixel brightness of conventional MR images is defined in an arbitrary grayscale (e,f). As a result, only a qualitative pattern recognition is possible when the suspected region (i.e., the tumor) is assessed against the background of the target anayomy (i.e., the brain). On the other hand, quantitative maps spatially resolve a meaningful metric (a,b) to detect changes over time (c) and between different samples (d). On a standardized measurement scale of percent moisture, the texture characteristics of a jellybean (e.g., crispy or chewy) can be objectively determined even from a randomly selected part of the image.
Using the same MRI scanner, it is possible to assign meaningful numbers to the images and this approach turns out to be the most common MRI method in food engineering Mariette et al., 2012Ziegler et al., 2003. Fig. 1 illustrates the added value of quantitative MRI (qMRI) when applied to a sample familiar to everyone: a jellybean. The moisturization map indicates that the jellybean has formed a crispy shell while remaining chewy at the center, which is the desired texture Fig. 1b. Given that the level of chewiness is determined by a threshold on a standardized measurement scale, a randomly selected part of the image can be still characterized by comparing selected pixel values against the established threshold Fig. 1. This feature of qMRI offers an objective insight into how the texture of this soft confection changes over time, which would help determine its best before date (Fig. 1, prognosis).
The ability to reveal what underpins the appearance of visually similar samples is yet another powerful feature of qMRI. In a Bean-Boozled challenge, which is a Russian roulette of jellybean flavors, tasty flavors are mixed with nauseous look-alikes Gambon, 2015. For example, a green jellybean may taste like lime (tasty) or lawn clippings (nauseous) in the Bean-Boozled game Fig. 2. Therefore, no matter how experienced the player is, the chances of picking up a lime-flavored bean is as good as tossing a coin. Conventional MR images of a handful of green jellybeans do not offer a distinguishing feature, but only reveal their structure. As a result, the chances of making an unfortunate choice remain the same Fig. 2.
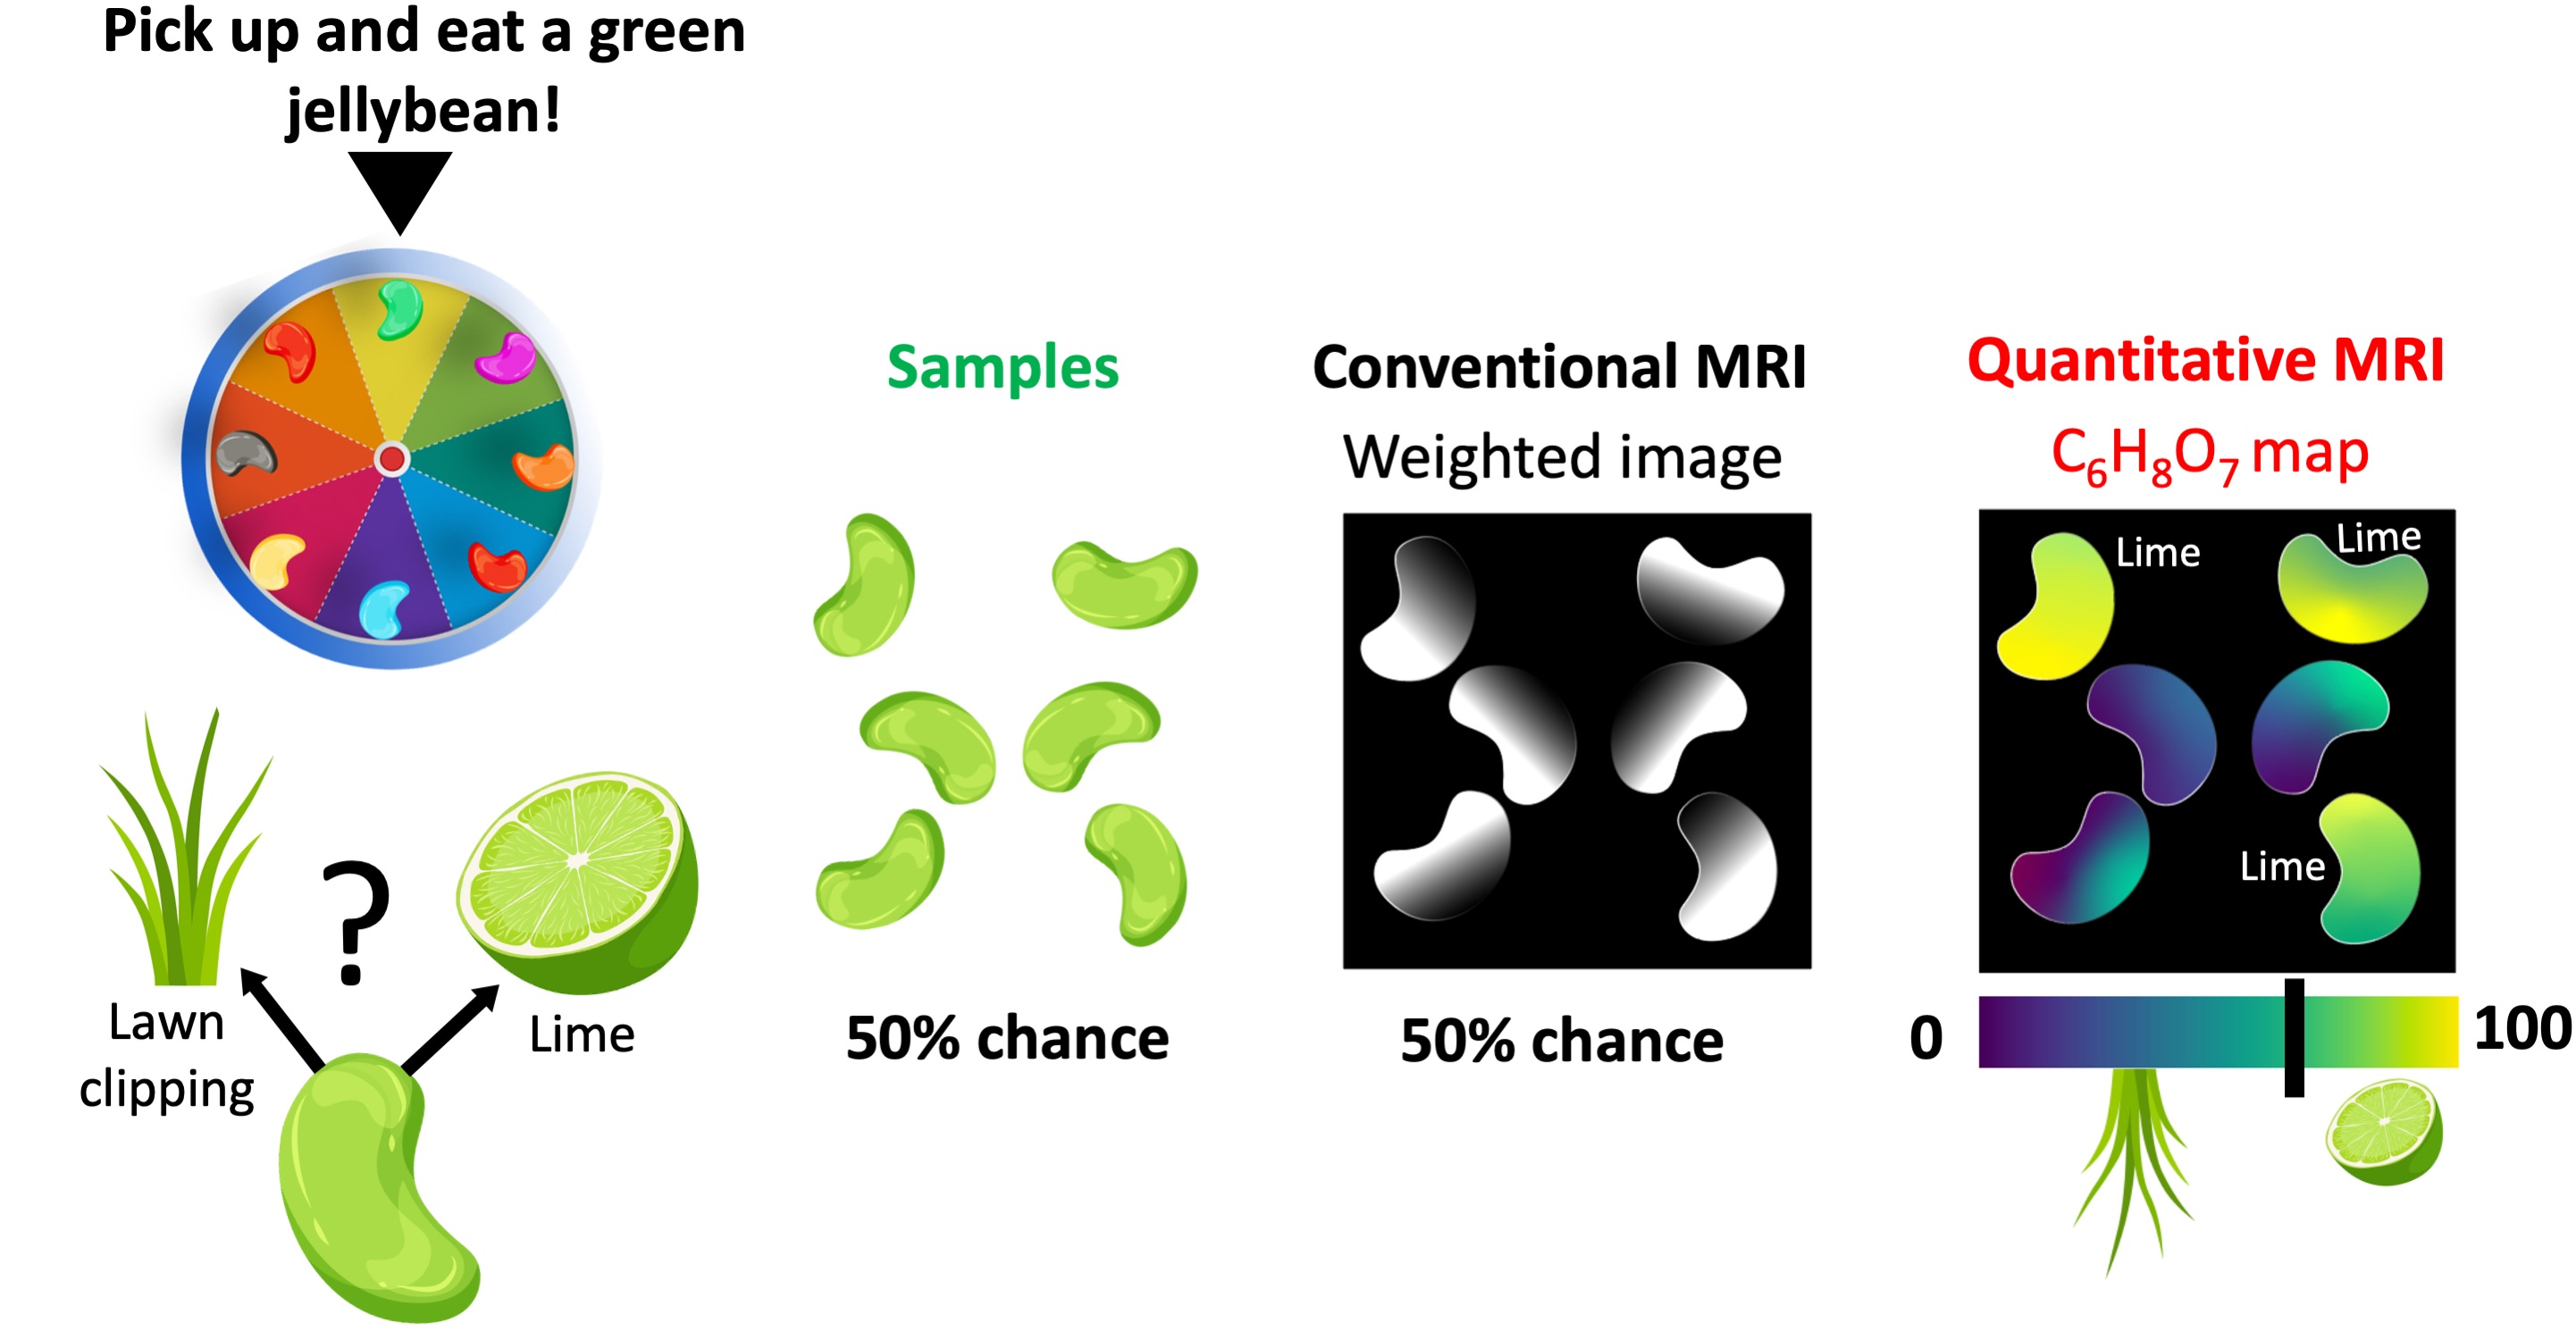
Figure 2:The comparison of conventional and quantitative MRI in a Bean-Boozled game, where the task is picking up and eating a green jellybean. Out of 6 green beans, half of them taste like lime (tasty) and the remaining are lawn clipping flavored (nauseous). Conventional MRI is not sensitive to either aroma, as a result the beans show similar contrasts. On the other hand, a quantitative mapping method sensitive to citric acid (C6H8O7) can help reveal lime-flavored beans.
On the other hand, spatially resolving a quantitative property that is sensitive to either flavor would step up our game in making the right decision. For example, a qMRI method capable of mapping the distribution of citric acid (C6H8O7) – the chemical compound that gives citrus fruits a sour taste – would help distinguish lime-flavored green beans. Even though the grass-flavored beans may contain a slight amount of C6H8O7 (used as lawn fertilizer), establishing a threshold can help make an informed decision (Fig. 2), giving the players a competitive edge in the bean-boozled game (diagnosis).
Note that the pixel brightness of the conventional (weighted) image has contributions from the C6H8O7 concentration. However, it is also affected by several other factors, such as water density and glucose content. Therefore, understanding the relationship between the pixel brightness and the flavour depends on the experience and subjective interpretation of the observer.
NMR is a spectroscopy method that gives information about the chemical makeup of the analyzed substance. In analogy with the jellybean example, an NMR measurement is similar to quantifying the amount of C6H8O7 from the fragments of a green jellybean (Fig. 2). If we used NMR for the bean-boozled challenge, we would be looking at a list of values to pick up a lime-flavoured bean instead of looking at a map.
1.2A spicy history of NMR and MRI
The evolution of NMR into MRI is a turbulent story Dreizen, 2004 that starts with the development of the first MRI scanner (1980) and leads to a Nobel Prize (2003). In 1971, Damadian published a study on the use of NMR-based T1 and T2 values for detecting malignant tumors Damadian, 1971. Based on this work, he issued a patent application titled “an apparatus and method for detecting cancer in tissue” in 1972, which was accepted in 1974 Damadian, 1974.
However, an actual image was out of the picture until Lauterbur was finally able to publish his work in 1973, showing a crude weighted-image of two liquid filled tubes Lauterbur, 1989. Lauterbur’s publication was delayed because the initial submission was desk-rejected by the editors of Nature, and his university did not find his work valuable enough to submit a patent Dawson, 2013. Around the same time but an ocean apart, Mansfield was applying NMR to image crystals by borrowing a concept dubbed k-space from 2D crystal structures Turner, 2017. This approach led Mansfield to develop a fast image generation method, bringing MRI closer to practical reality Mansfield & Maudsley, 1977.
With undeniable insight from the studies of Lauterbur and Mansfield, Damadian’s team built the first human MRI scanner in 1978 and made it commercially available in two years. Around the same time, GE started manufacturing scanners without paying royalty to Damadian as consideration for the patent. In the decade that follows, GE sold nearly 600 scanners, for which Damadian’s company Fonar filed a patent infringement lawsuit in the late 1990s and awarded $128,705,766 as a compensation for pecuniary damages (Cir., 1996).
1.3A bitter U.S. Supreme Court verdict
Returning to the jellybean analogy, Damadian’s patent was mainly describing a device to scan whole jellybeans for a complete C6H8O7 measurement. The key invention of the patent was to collect multiple measurements at different locations of the jellybean without fragmenting them. Later on, Lauterbur and Mansfield developed the methodology to create weighted images of the jellybeans. This was followed by Damadian marketing the first device that can generate weighted images of whole jellybeans (Fig. 2) and the U.S. Supreme Court reached the verdict that GE infringed Damadian’s patent. The original judgement on the verdict reads:
On May 27, 1997 the Honorable Wm. H. Rehnquist, Chief Justice, the United States Supreme Court, enforced the Order of the Federal Circuit Court of Appeals and ordered GE to pay Fonar. GE paid Fonar $128,705,766 for patent infringement. GE was further restrained from any use of Fonar technology.” “The Court found that GE had infringed U.S. Patent 3,789,832, MRI’s first patent, which was filed with the U.S. Patent Office in 1972 by Dr. Damadian. The Court concluded that MRI machines rely on the tissue NMR relaxations that were claimed in the patent as a method for detecting cancer, and that MRI machines use these tissue relaxations to control pixel brightness and supply the image contrasts that detect cancer in patients.
To paraphrase the reasoning behind this decision using the jellybean analogy:
- GE manufactured and sold 600 scanners capable of generating weighted images of the jellybeans,
- the weighted images are influenced by the C6H8O7 concentration,
- lime-flavored jellybeans have higher concentrations of C6H8O7,
- thus, GE scanners are designed to identify lime-flavored jellybeans, which infringes on Damadian’s patent.
Although the U.S. Supreme Court decision implied that Damadian owns the intellectual property rights for MRI scanners at that time, the 2003 Nobel Prize in Medicine was shared between Lauterbur and Mansfied only. Damadian spent nearly $300,000 for full page ads in popular print media outlets to claim his rights to the 2003 prize, yet the situation has remained unchanged up to this date. The notes on why Damadian was not included in the prize will be available in 2053 Harris, 2003.
The court’s interpretation of the difference between the Fonar’s patent and GE MRI scanners perfectly captures the essence of qMRI, which is to enable objective and consistent comparisons by tagging each pixel with a precisely defined score that ranks a physical characteristic. Although the physical property estimated by qMRI contributes to the pixel brightness of conventional images, the conventional images are presented in an arbitrary grayscale. This is the reason why individual pixels of a weighted image have numbers, but no (physical) value.
To conclude, there is a critical difference between detecting abnormalities based on pixel brightness (conventional MRI) and tissue characterization using quantitative metrics (qMRI), and the court’s interpretation of this difference cost GE $129 million. With this central distinction in mind, the following sections will introduce how we can use the same MRI scanner for both qualitative and quantitative imaging.
- Troutman, M. Y., Mastikhin, I. V., Balcom, B. J., Eads, T. M., & Ziegler, G. R. (2001). Moisture migration in soft-panned confections during engrossing and aging as observed by magnetic resonance imaging. Journal of Food Engineering, 48(3), 257–267.
- Ziegler, G. R., MacMillan, B., & Balcom, B. J. (2003). Moisture migration in starch molding operations as observed by magnetic resonance imaging. Food Research International, 36(4), 331–340.
- Mariette, F., Collewet, G., Davenel, A., Lucas, T., & Musse, M. (2012). Quantitative MRI in food science & food engineering. Encyclopedia of Magnetic Resonance by John Wiley.
- Gambon, D. (2015). The Crazy World of Candy. Tandartspraktijk, 36(7), 17–23.
- Dreizen, P. (2004). The Nobel prize for MRI: a wonderful discovery and a sad controversy. The Lancet, 363(9402), 78.
- Damadian, R. (1971). Tumor detection by nuclear magnetic resonance. Science, 171(3976), 1151–1153.
- Damadian, R. (1974). Apparatus and method for detecting cancer in tissue (US3789832A). https://patents.google.com/patent/US3789832?oq=damadian+1971
- Lauterbur, P. C. (1989). Image formation by induced local interactions. Examples employing nuclear magnetic resonance. 1973 [Journal Article]. Clin Orthop Relat Res, 244, 3–6. https://www.ncbi.nlm.nih.gov/pubmed/2663289
- Dawson, M. J. (2013). Paul Lauterbur and the Invention of MRI. MIT Press.
- Turner, R. (2017). Peter Mansfield (1933–2017). Nature, 543(7644), 180–180. 10.1038/543180a
- Mansfield, P., & Maudsley, A. A. (1977). Planar spin imaging by NMR. Journal of Magnetic Resonance (1969), 27(1), 101–119. https://doi.org/10.1016/0022-2364(77)90197-4
- Harris, R. F. (2003). Nobel grudge. Current Biology, 13(22), R857.