
14 tweets

1/13 I just published an interactive blog post on the topic of inversion recovery T1 mapping for quantitative MRI! #ISMRM
Even if qMRI isn't your thing - it has a lot of cool technical features under the hood that might interest you.
qmrlab.org/jekyll/2018/10/23/T1-mapping-inversion-recovery.html
Even if qMRI isn't your thing - it has a lot of cool technical features under the hood that might interest you.
qmrlab.org/jekyll/2018/10/23/T1-mapping-inversion-recovery.html
2/13 The interactive tutorial was built using a wide range of free open-source softwares, packages, and tools: @qMRLab @plotlygraphs @ProjectJupyter @ScriptOfScripts @mybinderteam @Docker @GnuOctave @ThePSF @github
3/13 On the front-end side, the tutorial includes several interactive figures, made possible thanks to @plotlygraphs. These allow you to see in your browser how the plotted curves behaves when you change a parameter:
4/13 You can also view the values of the curves directly: 
5/13 ... and view the different raw images that were used for the fitting to produce the final result/map: 
6/13 Thanks to a nifty feature of @ScriptOfScripts, the code used to generate the data used in the interactive figures of the blog post can also be viewed on that same page with the click of a button: 
8/13 The entire blog post was generated using @ScriptOfScripts & @ProjectJupyter – the self-contained Jupyter Notebook is hosted on @github here: github.com/qMRLab/t1_notebooks – feel free to leave any feedback/technical questions there.
9/13 Even better though, you can view the Jupyter Notebook in your browser using our @Docker setup with @mybinderteam here: mybinder.org/v2/gh/qMRLab/t1_notebooks/master?filepath=ir_blog%2FInversionRecovery.ipynb 
10/13 If you were still curious about certain things after reading the blog post, you can now go there and change the code / generate new figures.
11/13 Another cool thing about this setup is that the setup uses @ScriptOfScripts, allowing us to use multiple kernels (i.e. programming languages) within the same notebook. The data can be transferred between them, which is how I made @plotlygraphs using @GnuOctave code 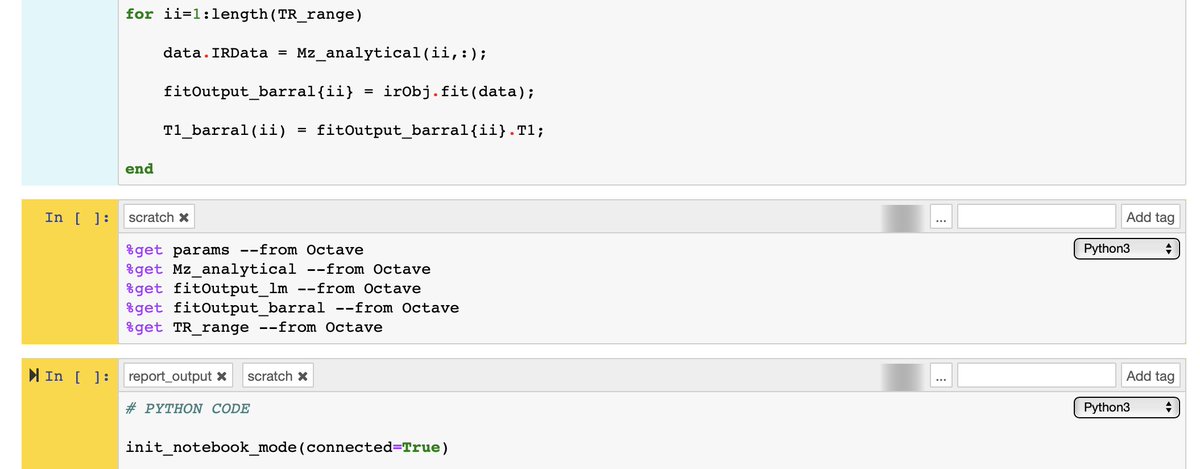
12/13 If you feel keen into doing something similar for your own work – feel free to fork the repo and use it as a template: github.com/qMRLab/t1_notebooks. The HTML used for the blog is generated directly from the @ProjectJupyter notebook thanks to @ScriptOfScripts with a few clicks: 
13/13 Thanks to the whole @qMRLab team (@Stikov @agahkarakuzu @ILeppert @TommyBoshkovski @duvaltanguy Julien Cohen-Adad & Bruce Pike) for all the help & proofreading offered along the way! Particular thanks to @ILeppert for adding extra features to the @qMRLab inversion recovery model !
14/13 Also, this project was supported by the Canadian Open Neuroscience Platform @NeuroLibre – keep an eye out for more cool stuff coming out of CONP in the future ! conp.ca/en/platform-du-canadian-neuroscience-ouvert/